Beware of the Shiny Objects: Put Marketing Strategy & Analytics First
If you have a young child, I’ll wager you’ve seen Moana more than seven times. Or maybe you’ve seen it without a tiny human because hey, it’s a quality Disney movie with a pretty good message—unlike Frozen (but I digress). I bring Moana up because one of its villains is a giant crab named Tamatoa, who is obsessed with shiny objects. And I don’t want you to be like Tamatoa. Shiny objects are always appealing as potential quick wins. Maybe you saw Jet.com’s hugely successful launch, Dollar Shave Club’s “Our Blades Are F***ing Great” campaign, or read that Snapchat is (was) the fastest growing social media platform (in 2016). But as a decision maker, you should turn to your marketing strategy and analytics first before spending energy to mimic these thoughtful campaigns to drive perceived quick hits. You might not need more video content, or it could be a mistake to foray into a platform that doesn’t house your audience. (If your main audience is 50+ people, Snapchat is not going to magically turn your business around.)
Marketing Strategy First, Shiny Second
Simply put, before a company leaps into a shiny tactic, it should develop its underlying strategy. I’ll give you an example. Below is the outcome from a traffic-driving campaign and how it looks within Facebook, Google Adwords and Google Analytics. First, Google Analytics was implemented to track results. (If there is no process or system in place to read results, revisit your strategy.) Second, the traffic-driving campaign was set up within Facebook and Google as a pay-per-click (PPC) effort. The two immediate tables below highlight the results from within the specific platform analytics. While these campaigns had respectable click-through rates and relatively low cost per clicks, this is only part of the story.
Facebook Ad Analytics
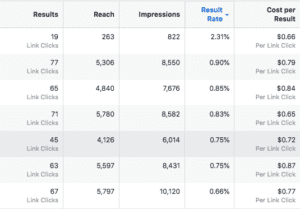
Google Adwords Analytics

Google Analytics

The above table highlights “Organic Search” traffic (mostly from Google search) in orange, with “Social” and “Paid Search” in red. The “Organic Search” website traffic is typically the best performing traffic as this is the audience that is raising their hand for your product or service. The goal is for all other channels to look as close to this as possible, even if not 100% obtainable. Using “Organic Search” as our baseline, we see two red flags in Google Analytics:
- High Bounce Rates: Only 1 out of 10 people in this campaign are reading past the first page. Compare this to 6 out of 10 for “Organic Search.”
- Low Goal Conversion Rates: The rate is around 0.20% for this campaign, compared to nearly 7% for “Organic Search.”
This campaign, while driving traffic to the website, is actually driving poor quality traffic that is not converting into sales or any other goals (such as email capture). This campaign, while relatively easy to implement, was set up to fail as there was no strategy or thought behind it. If there was a strategy, the right traffic would be on the website and spending more time there. Herein lies the value in taking a step back and focusing on a sound, quality strategy that outlines:
- Key Personas: Who are our ideal buyers? What is our core audience?
- The Best Way(s) to Communicate with Them: What voice do we use, and what content can we create or serve based on buyer intent?
- Measurable Goals: What are the outcomes we want to achieve, and how will we measure them?
With these elements laid out, you can:
- Better target with several tactics (not just the popular ones) and utilize those that better fit the needs of your potential clients (e.g., people 45 – 55 years old with a household income above $100K);
- Develop an ad or campaign that will catch your audiences’ attention (e.g., maybe video is better than a static ad for your target);
- Set up a proper landing page with a Call to Action (CTA) that aligns with the campaign; and lastly
- Set measurable goals (e.g., capture 30 emails during the campaign).
Marketing Analytical Elements
Let’s outline a couple important analytical best practices to consider, using the table below as a reference.
Watch Your Website Content
The website above has 19% of traffic coming from “Organic Search,” which should make up 40 – 50% of overall traffic. If you see something similar to the above in your tracking, your current website is not working the way it should. The right content will speak to your audience and bring them to your website organically. If that’s not happening, there might be a mismatch between your audience and your content. Another content indicator is “Bounce Rate.” Based on the numbers above, 3 out of 4 people are leaving the website before clicking to another page, which means they’re not finding what they are looking for. If you see a high bounce rate, it might mean you need to create clearer calls to action or write more engaging content for our audience. If you see numbers like the above, it can also signal an issue with your analytics setup.
Analytics Setup
Based on the table, this website only has 3 users from email in this time span, which is grossly different from what their Email Service Provider (ESP) platform suggests. Therefore, we know the ESP (e.g., Mailchimp, HubSpot, Salesforce Marketing Cloud) isn’t speaking to Google Analytics. This means we need to go back to analytics setup before pushing forward. We can’t measure the results of a campaign if there are no results in our measuring platform. Another indicator of a poorly implemented Google Analytics instance is a high amount of “Direct” traffic, which is usually designated as traffic the inputted a URL directly into their browser or navigated via bookmark. If you’re seeing a lot of that traffic, it can mean Google Analytics is not set up properly. This is common for companies that maintain domains (e.g., company.com) and subdomains (e.g., info.company.com). If Analytics code isn’t added correctly, Google can lose visitors’ information as they move between pages. It then falsely attributes those visitors as “Direct” visits.
Marketing Strategy & Analytics Before Temptation
Businesses are always looking for new ways to increase revenue, but unfortunately, there’s no surefire, universal approach. Instead, it comes down to developing a unique strategy and selecting your tactics accordingly. Company stakeholders typically put much thought into a business plan, and a marketing plan should be no different. A thoughtful marketing strategy, while slower to implement, will save companies time, effort and resources that could otherwise be lost on the shiny tactics. In other words, don’t be Tamatoa.