
Marketing Analytics Dashboards: Solving Common Challenges for Marketers
A couple of years ago, as we were auditing Marketri’s various marketing analytics dashboards, we realized we had some questions that our current reporting systems couldn’t answer. At least not at first glance.
Most marketers rely on tools like Google Analytics, social media analytics, their marketing automation dashboards, SEO tools, and more to get a clear picture of what’s working and what’s not—and we did, too.
However, bringing these various pieces together was another story.
Related: The Top 5 Marketing Pain Points for High Growth Businesses and How to Fix Them
Our biggest question was around what most marketers want to know: which tactics actually bring in customers?
And finding that answer within our dashboards left something to be desired.
The challenge with traditional marketing analytics dashboards
Marketri was not alone in these challenges. Dispersed multi-platform metrics can frustrate any marketer who wants to present a holistic view of analytics to their team.
It’s tough to find a one-stop shop for analytics. Marketing automation platforms provide one possible solution, bringing in data from social media marketing and other areas to aggregate data in one place.
However, this doesn’t provide an entirely holistic view. Ideally, we would have a reporting platform that makes it easy to see which efforts are actually working towards meeting marketing goals, and better yet, business goals. When it all boils down, this is what marketers need to see to make the right decisions moving forward and to prove marketing value and ROI to stakeholders.
What companies really want to know
The gaps in traditional, dispersed marketing dashboards leave out some of the biggest pieces of the puzzle. These include…
- Inability to tie marketing efforts back to ROI and sale. Increased website traffic, more likes on LinkedIn, and improved keyword positions are all valiant marketing goals—but they all miss the most important value…business value. The ability to tie an email campaign, social post, or gated piece of content back to a close or sale is a game changer for us and for our clients.
- Inability to map marketing efforts across channels. SEO platforms like Semrush and Ahrefs might show you estimated traffic or average keyword positions, but it’s difficult to translate that into marketing results or business value. The dashboard allows us to overlap metrics from different reporting platforms (Google Analytics, HubSpot, SEMRush, Marketo, LinkedIn, and more) to find the correlation between marketing initiatives and improved metrics. For instance, maybe you want to tie keyword results back to increased pageviews and longer average time on page. Without these overlapped, enhanced metrics, marketing departments and agencies are just guessing.
- Unique metrics you can’t find natively. The ability to track your funnel velocity, acquisition breakdown by funnel stage, and more are just a few examples that are tricky to nail down in other platforms (or completely unavailable). The availability of these metrics help eliminate siloes between sales and marketing departments and address business development goals together.
- Too much information. Sometimes, data dashboards will offer marketers and teams plenty of information. The problem is making sense of it all. Often we lose precious time chasing rabbit holes that don’t elicit valuable information. Rather than getting lost in metrics you don’t need to address, it’s more helpful to view significant metric changes at a high level and drill-down accordingly.
It could take a skilled marketer with expertise in digital marketing and data analytics hours to interpret data in the way their team would like.
Manual data aggregation and interpretation on a monthly basis is never an ideal way to manage the process, as a marketer’s time could be spent on more high-value tasks.
Customizing the data to your needs
So how can you effectively customize data to your specific needs and tie that back to marketing goals and business objectives?
At Marketri, we chose to make our own dashboard for us and our clients. We developed this dashboard with Tableau because we were able to utilize the data points we already had from Hubspot, Google Analytics, LinkedIn, etc. to set and customize a data range.
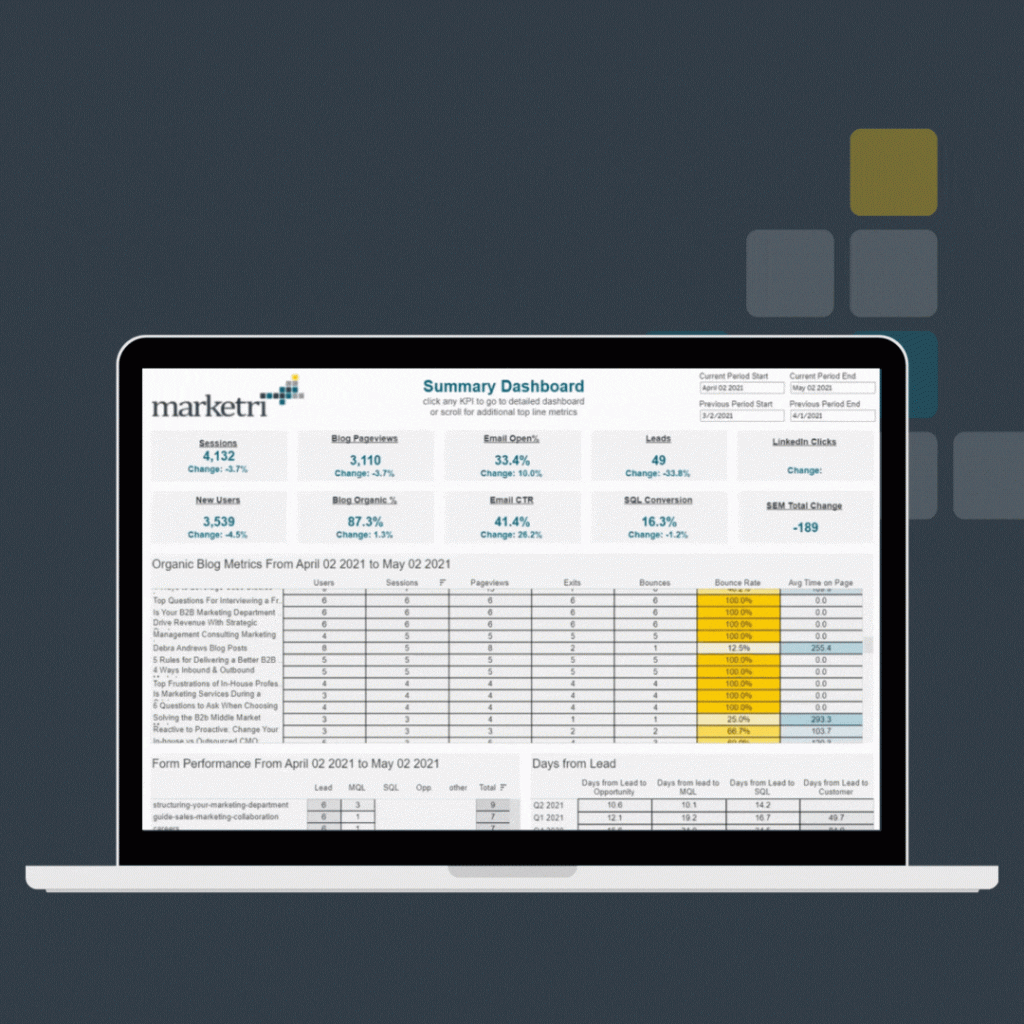
We could customize each dashboard per client or per business. And best of all, we could create an executive summary with a quick way to see how marketing efforts are (or aren’t) addressing business pain points.
We were able to quickly determine that a content piece we knew was downloaded frequently didn’t actually result in sales-qualified leads, which a lesser downloaded piece did. This type of information is invaluable for making decisions that truly have an impact.
Eliminating TMI and honing in on strategy
Marketri’s goal was to make sure data outputs would provide an opportunity for a high-level overview as well as a drilldown of certain tactics and channels.
This dashboard would not be tied to any native integrations, so it could bring in data from a variety of sources. Overall, you can…
- Aggregate data for a comprehensive look at marketing reporting.
- Pinpoint which marketing actions drive business value.
- Begin to predict your marketing funnel.
High-quality predictable leads are always the goal, and a quality dashboard should make it easy to see which efforts return those leads.